
More Than SpO₂ — What the Perfusion Index Truly Reveals
Clinical Insights & Technology
More Than SpO₂ —
What the Perfusion Index Truly Reveals
The Silent Gap in Monitoring
Have you ever wondered why your pulse oximeter shows a perfect 99% SpO₂ while you still feel short of breath? Or why, on a cold morning, the device struggles to display any reading at all?
The answer lies in a neglected metric: PI (Perfusion Index). While SpO₂ measures the oxygen saturation of the blood present, PI measures the pulse strength at the sensor site. It is the vital “context” that tells you if your circulatory system is delivering that oxygen effectively to your extremities.
The Clinical Benchmark: PI Ranges & Significance
Based on clinical research, PI serves as a numerical representation of peripheral vasomotor tone. Here is how to interpret the data:
Primary Sources:
PubMed 25720415: Baseline PI values in clinical populations
PubMed 12072670: PI as a predictor of peripheral vasomotor tone
Springer 2024: Advancements in PI-led clinical diagnostics
UPM60 — Engineered for clinical precision. Featuring a 3.5" touchscreen and advanced PI Trending,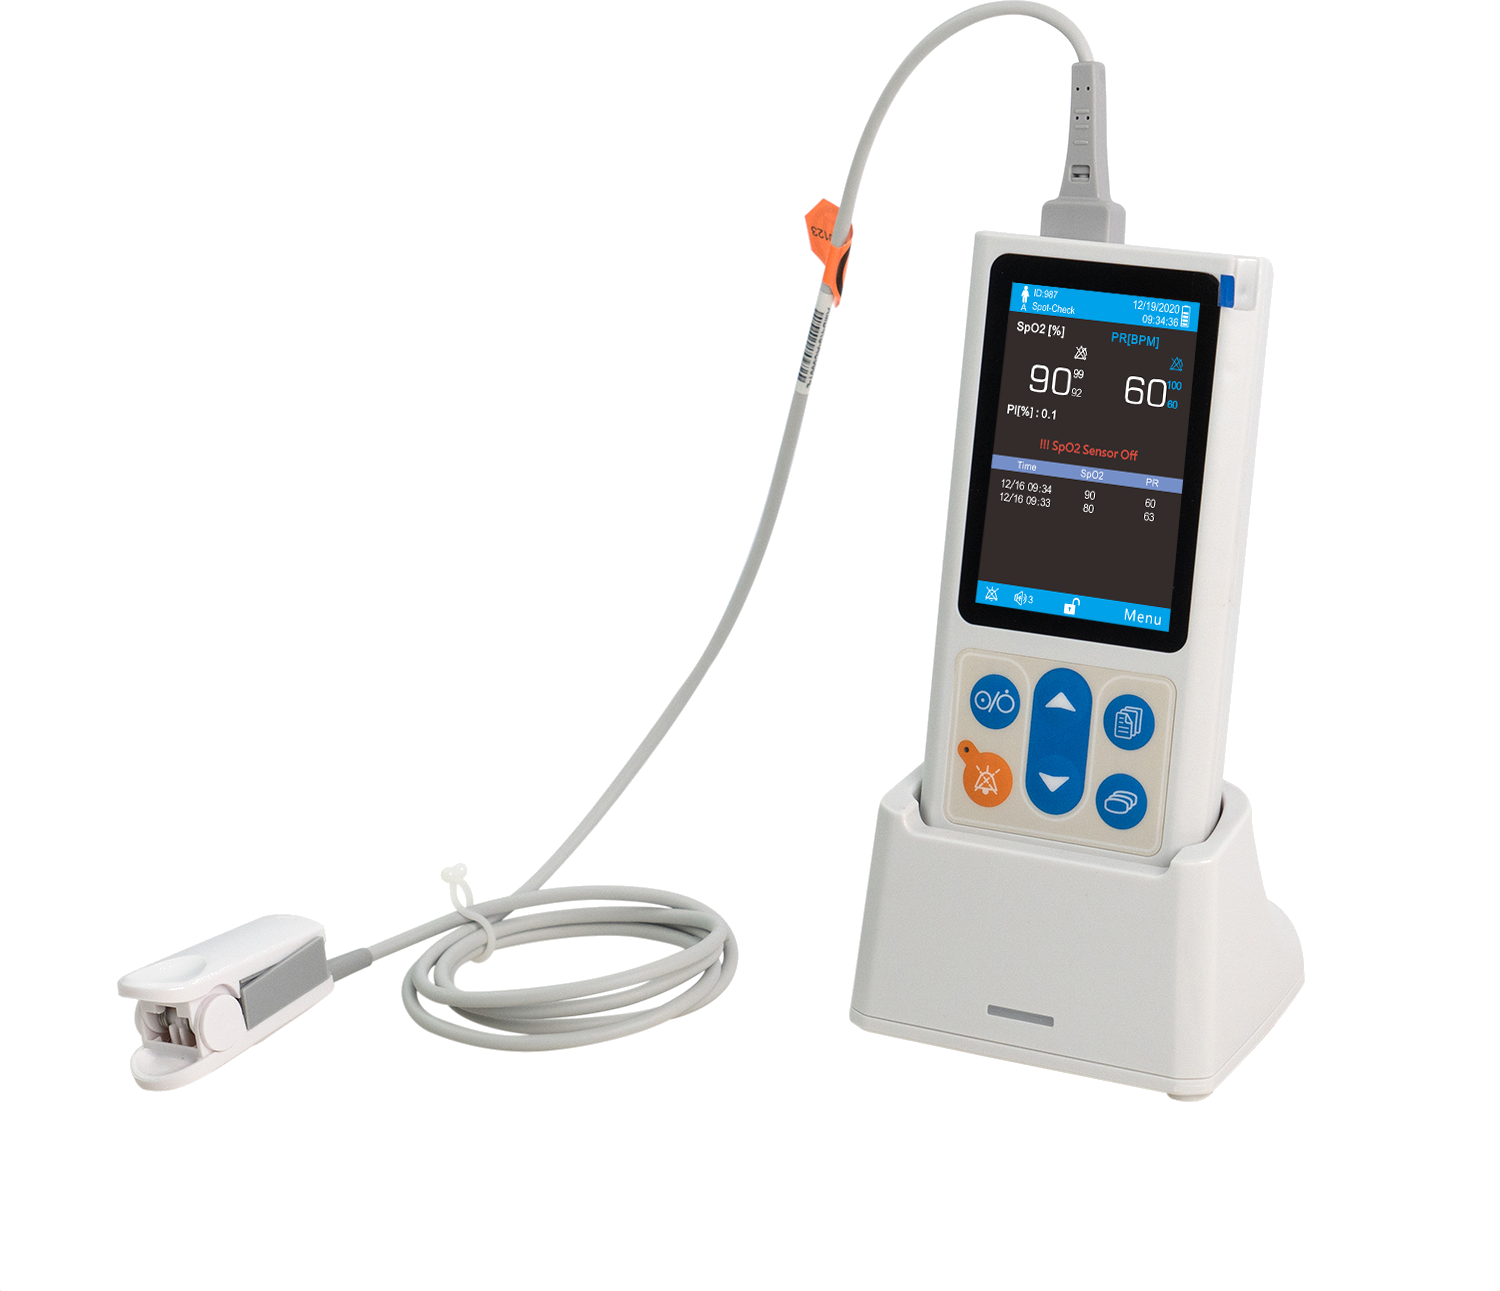 it transforms complex perfusion data into a clear, actionable histogram. Learn more →
The Physics of the Pulse
At the heart of pulse oximetry is Photoplethysmography (PPG). When the sensor’s light passes through your finger, the resulting signal is split into two distinct components:
- DC (Direct Current): This is the constant, non-pulsatile part of the signal. It represents light absorbed by bone, connective tissue, and venous blood.
- AC (Alternating Current): This is the pulsatile part of the signal. It represents the fresh, oxygenated arterial blood rushing into the capillaries with every heartbeat.
The Formula of Perfusion:
PI = (AC / DC) × 100%

“Imagine DC as a permanent reservoir of water, while AC is the fresh spring rushing in every second. The pulse oximeter’s job is to precisely capture that tiny ‘fresh spring’—often less than 1% of the total volume—from within the massive ‘reservoir.’ This puts extraordinary demands on the sensor’s sensitivity.”
The Intelligence of Low Perfusion Algorithms
In conditions of Low Perfusion (PI < 0.3%), the “Spring” becomes a mere trickle. Extracting accurate data requires advanced Digital Signal Processing (DSP) and “Weak Perfusion” algorithms.
- The R-Value Calculation: The device measures the absorption of Red (660nm) and Infrared (940nm) light to determine the ratio of oxygenated (HbO₂) vs. deoxygenated (Hb) hemoglobin:
R = (AC/DC)660 / (AC/DC)940
- Signal Extraction & Noise Filtering: When the signal-to-noise ratio is low, advanced algorithms like Discrete Saturation Transform (DST) create a “noise map.” By subtracting movement artifacts and venous interference, the device can “harvest” the true arterial signal even when the pulse is nearly undetectable.
- Adaptive Gain Control: Professional systems automatically trigger a “Weak Signal Mode” when PI drops, increasing the gain intensity of the sensor to maintain a stable SpO₂ reading down to a PI of 0.1%.
Phase 3: Real-World Applications
Raynaud’s & Peripheral Sensitivity
For individuals with Raynaud’s Phenomenon or chronically cold hands, standard oximeters often provide “Error” messages or false readings. Because their peripheral vessels are hyper-sensitive and prone to constriction, their baseline PI is naturally low. Reliable monitoring in these cases requires medical-grade sensors capable of high-fidelity signal extraction.
Post-Operative Recovery: The Power of the Trend
In clinical recovery, the trend is more important than a single reading.
Research Note: PubMed 33891250 highlights that monitoring PI trends can predict post-operative complications hours earlier than traditional vital signs.
Conclusion
The Perfusion Index offers a valuable additional layer of insight beyond the familiar SpO₂ percentage, providing a non-invasive window into peripheral perfusion and circulatory dynamics. From early detection of perfusion changes in anesthesia and critical care to more reliable monitoring for patients with Raynaud’s or during post-operative recovery, PI enhances our understanding of oxygen delivery in real time — especially when advanced signal-processing algorithms are employed.
Normal Blood Oxygen Saturation Levels in Elderly vs Young Adults: What’s the Difference?
Does Nail Polish Affect Pulse Oximeter Accuracy? — The Science Behind the Signal —
Related Article